Multimodal processor rewrite: 5x lower latency
Younes El Hjouji
TLDR
During video inference, vLLM runs a preprocessing step to convert the video bytes into tensors that later go through the vision encoder. For a 15-frame video, this step takes 500ms, and at just 5 queries per second, the p90 latency reaches 11 seconds. We cut it to 80 ms for both the Gemma 4 and Qwen3 model families, bit-identical. This post shows how.
| baseline p90 | optimized p90 | |
|---|---|---|
| 15 frames, sequential | 428 ms | 81 ms |
| 15 frames, 5 QPS sustained | 11,574 ms | ~80 ms |
Why this matters
Vision AI is leaving the chatbox and moving into robots, computer-use agents, and drones. These are sensory loops where the budget from frame-in to action-out is tens of milliseconds. Latency is now a first-order product problem.
But the inference engines we depend on were built for text-in, text-out throughput. Multi-modal support was added after the fact, with latency at the tail of priorities. The defaults, the APIs, and the assumptions all reflect that history.
We are building the infrastructure for realtime vision AI at Overshoot.
While benchmarking on Qwen3.6-27B-FP8 in an H200, we hit a case that should have been routine: modest video input (15 frames at 480p), modest QPS (5), p90 inference latency over 15 seconds.
vllm gotcha. By default, vllm and Qwen3-VL silently downsample video to roughly 2 fps before the processor sees
it. A 15-frame benchmark accidentally becomes a 6-frame-shaped workload unless you pass do_sample_frames=false in
mm_processor_kwargs. We did.
The bottleneck: CPU video processing
In a case like this, the usual suspect is the GPU struggling to handle the large number of input tokens produced by high-QPS video requests. When latency spikes, it is natural to assume the model is simply being asked to do too much work.
But that was not what profiling showed.
Detailed timing showed that the bulk of the latency happened before the request even touched the GPU. More than 11 seconds were spent inside CPU processing, preparing the video for the model.
The same workload at other input shapes does not show this problem:
| input | sequential p90 | 5 QPS sustained p90 |
|---|---|---|
| single image | 23 ms | 22 ms |
| 6 frames | 85 ms | 81 ms |
| 15 frames | 428 ms | 11,574 ms |
The 1-frame and 6-frame cases are basically free. The 15-frame case is the one that breaks under load, and the gap between its sequential cost and its 5 QPS cost is where the puzzle lives.
▸🌀 Tangent — how vllm handles multi-modal input. Click here to expand for a primer on vllm and multi modal processing.
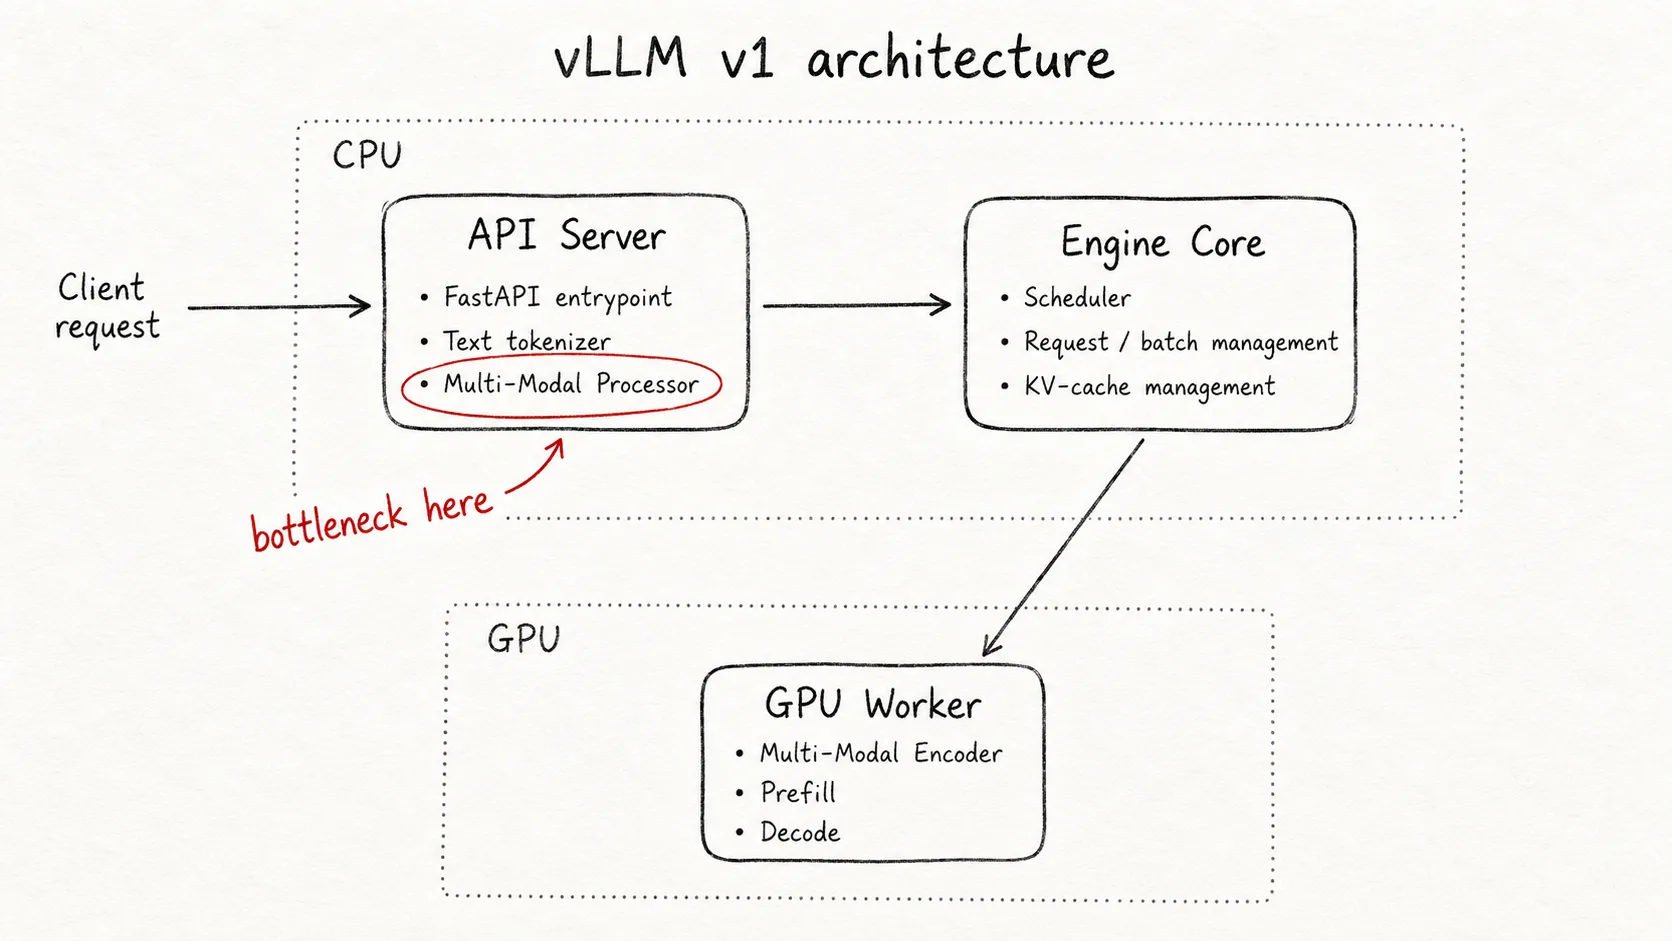
For this post, the important split is simple: the highlighted processor runs in the CPU API layer, and the multimodal encoder runs later on the GPU.
That tells us where the problem was, but not what the processor actually does. Let's zoom into the box that caused all the trouble.
Multi modal processor
This component goes by a few names across the stack: multi-modal preprocessor, renderer, mm processor. We will just call it the processor from here on.
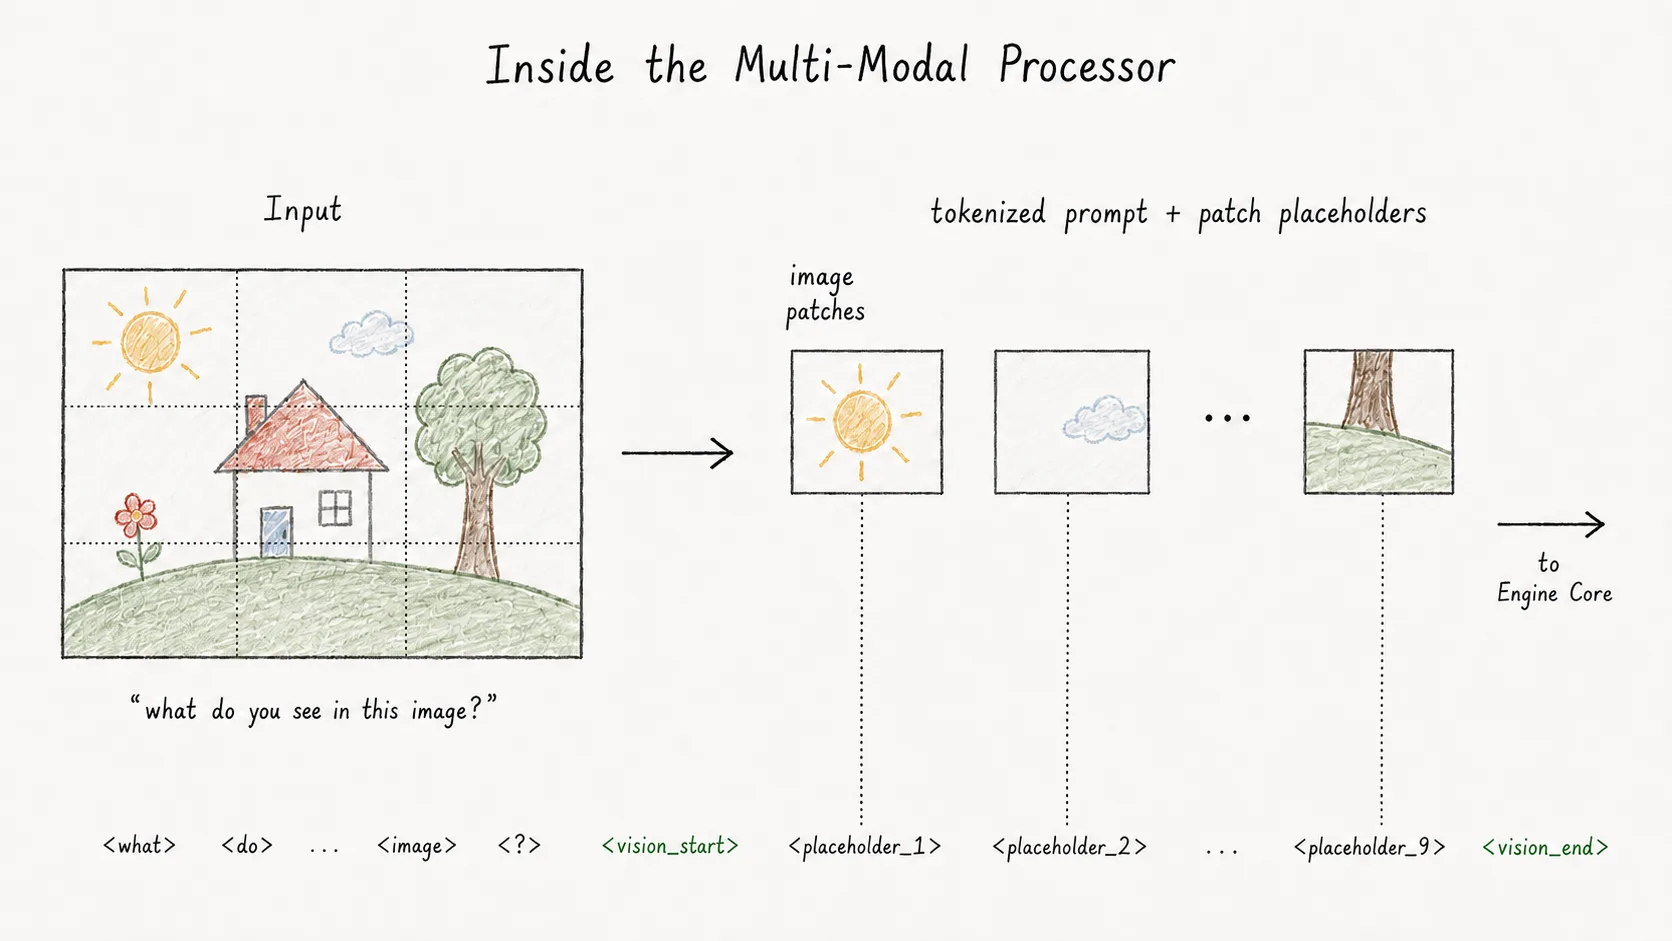
Inside the processor, the two inputs split into two tracks.
The text track turns the prompt into tokens:
"what do you see in this image?"
  -> [<what>, <do>, <you>, <see>, <in>, <this>, <image>, <?>]
The image track turns the image into visual pieces the model can handle. The image is resized, normalized, and broken into patches. This is the bulk of the processor's work:
image
  -> [patch_1, patch_2, ..., patch_n]
Then the processor stitches the two tracks back together. The text prompt gets expanded with placeholders for the visual patches:
[<what>, <do>, <you>, <see>, <in>, <this>, <image>, <?>,
 <vision_start>, <patch_1_placeholder>, ..., <patch_n_placeholder>, <vision_end>]
The processor output is the pair that moves forward into the engine:
- the patched prompt, now with the right number of visual placeholder tokens
- the processed image patches that will later be encoded on the GPU
This is the key idea: the processor does not understand the image. It prepares the accounting so that, later, the GPU encoder can turn the patches into visual representations and the language model can read them in the right positions.
Later, on the GPU, the encoder fills in the meaning behind those placeholders. It takes the exact pair produced by the processor:
Vision Encoder
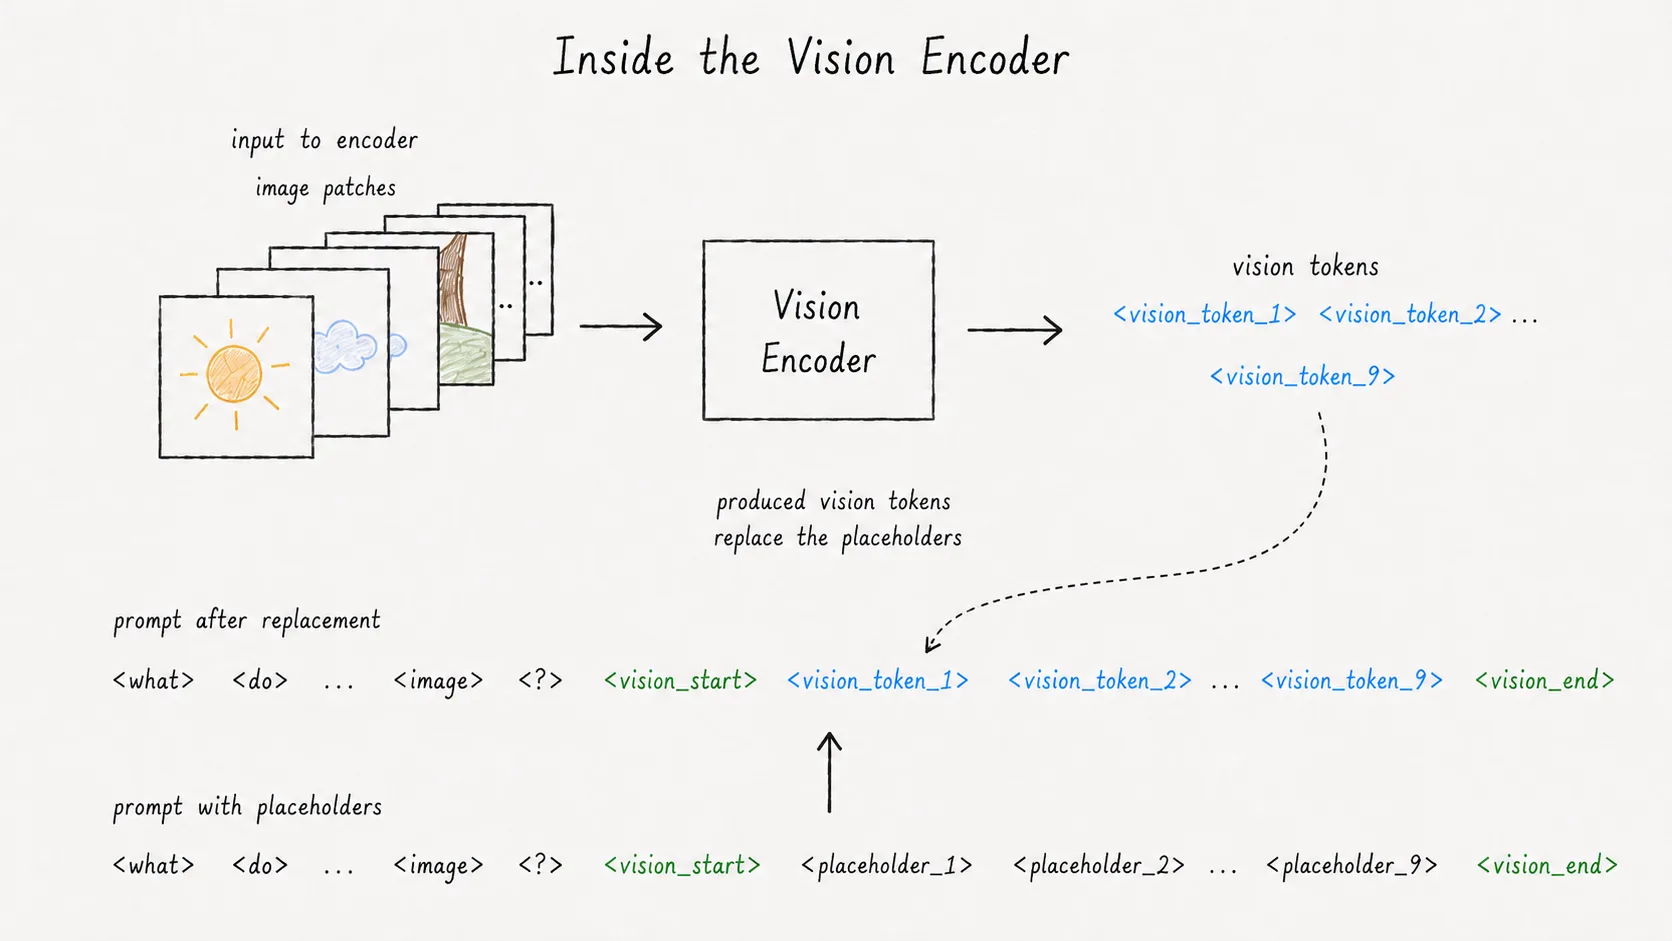
The prompt shape stays the same. The empty visual slots become vision tokens.
That is why the processor has to be both correct and fast. It is not doing the visual reasoning, but it decides the shape and placement of the visual information the GPU will use later, and prepares the vision encoder input patches.
That is the whole detour: the processor is the CPU-side step that shapes the text and media before the GPU ever sees the request. Now we can go back to the original latency number and ask why that supposedly boring CPU step turned into an 11-second problem.
Why is processing taking 11 seconds?
Why would processing a 15-frame video take more than 11 seconds?
The answer is rather simple: waiting.
The preprocessing step is handled by a single processor worker. Each step takes around 450ms. Under 5 queries per second, requests arrive faster than the preprocessor can drain them, causing the queue to grow and latency to explode.
vllm gotcha. The default --renderer-num-workers is 1. That single thread handles tokenization, chat template
rendering, and multimodal processing for every request hitting the API server.
So add workers?
At this point, the fix seems obvious: add more preprocessing workers.
Not so fast though.
Three constraints immediately show up:
- Event with the queue gone, the processing is still too slow at ~450ms before inference even begins.
- The inference engine runs inside a GPU host with limited CPU resources. In this blog, our H200 GPU host on Nebius only exposes 16 vCPU.
- The preprocessing worker is one of many workers in the inference stack.
Therefore, as we add more preprocessing workers, they begin competing on the same CPU resources as tokenization workers, inference runtime … etc
As a result, before we add more preprocessing workers, let’s reduce the amount of work being done.
▸🌀 Tangent — why threading bites in this kind of stack. You can collapse this by clicking here if you have already lived the GIL story for mixed Python/native services in production.
Why threading bites in this kind of stack
Python is horrible at threading
The GIL means only one thread runs Python code at a time. Native libraries only feel parallel because they release the GIL while they do their work in c++.
The implication is unkind. On a 16-core machine, pure-Python work is capped at one usable core. A workload that is roughly half Python and half native scales somewhere around 2x with naive threading no matter how many cores you give it; the GIL becomes the serial fraction Amdahl's law cares about, and it decides your ceiling.
The moment you have many threads ducking in and out of native code, you also get GIL contention and context switching overhead eating away at throughput.
You can spin up four workers and end up with the throughput of one and a half. Sometimes less.
For a sense of how much is left on the table, the experimental no-GIL Python build (PEP 703) routinely shows 3-8x speedups on previously GIL-bound workloads on the same hardware, just by letting threads actually run at the same time. That is the size of the gap default Python is quietly asking you to carry.

vLLM makes this worse than usual
Even before model code runs, a default vllm stack already has a small army of cpu-side actors competing for the same cores:
- a FastAPI api server with its own asyncio event loop
- a processor thread pool handling tokenization and processing (default
--renderer-num-workers=1) - the engine core process running the scheduler, request/batch management, and kv-cache bookkeeping
- the gpu worker process driving the encoder, prefill, and decode
- torch carrying its own intra-op and inter-op thread pools inside whichever of the above touches tensors
Adding threads at one bottleneck does not make it go away. It pushes somewhere else, or it smears across the whole process as a low hum of contention. Difficult to track with metrics, such issues fly under the radar until your system breaks under load.
Thread carefully
By rough count, a default vllm stack has at least a dozen threading knobs: api server worker processes, asyncio concurrency, processor thread pool size, torch intra-op threads, torch inter-op threads, and whatever native libraries you imported brought along (torchvision, pillow, opencv, tokenizers).
Most of them have separate environment variables, separate defaults, and no awareness of each other.
So when you decide to add threading, the next question is where.
Api server? Processor workers? Inside torch? Deeper, in native ops?
Each layer has its own opinion about who owns how many threads, usually set by someone solving a different problem from yours.
(We run face first into exactly one of these later in this very post, with a one-line default we did not write.)
Unclog before you thread
The order matters on a CPU-constrained node: cut each request down to its minimum CPU latency first, then profile how much parallelism the optimized workload actually needs. Threading wasteful code only spreads the waste, and turns a local bottleneck into whole-process CPU contention.
That is the threading detour: more workers might help a queue, but they do not make a slow request cheap, and naive parallelism can easily turn one bottleneck into whole-process CPU contention. Before deciding how many workers to run, we needed to find out where the 428 ms was actually going.
What's taking 428 ms?
We profiled the baseline processor hoping for the fun story: one slow function, one obvious fix, one number to brag about. Instead, a single 15-frame Qwen request was taking about 300ms of processing, spread roughly evenly across four codebases: vllm core, vllm's Qwen adapter, HF transformers, and torchvision.
The expensive parts each take 5 to 30ms, and they all live in different files in different projects owned by different teams. Ugh. No villain to blame.
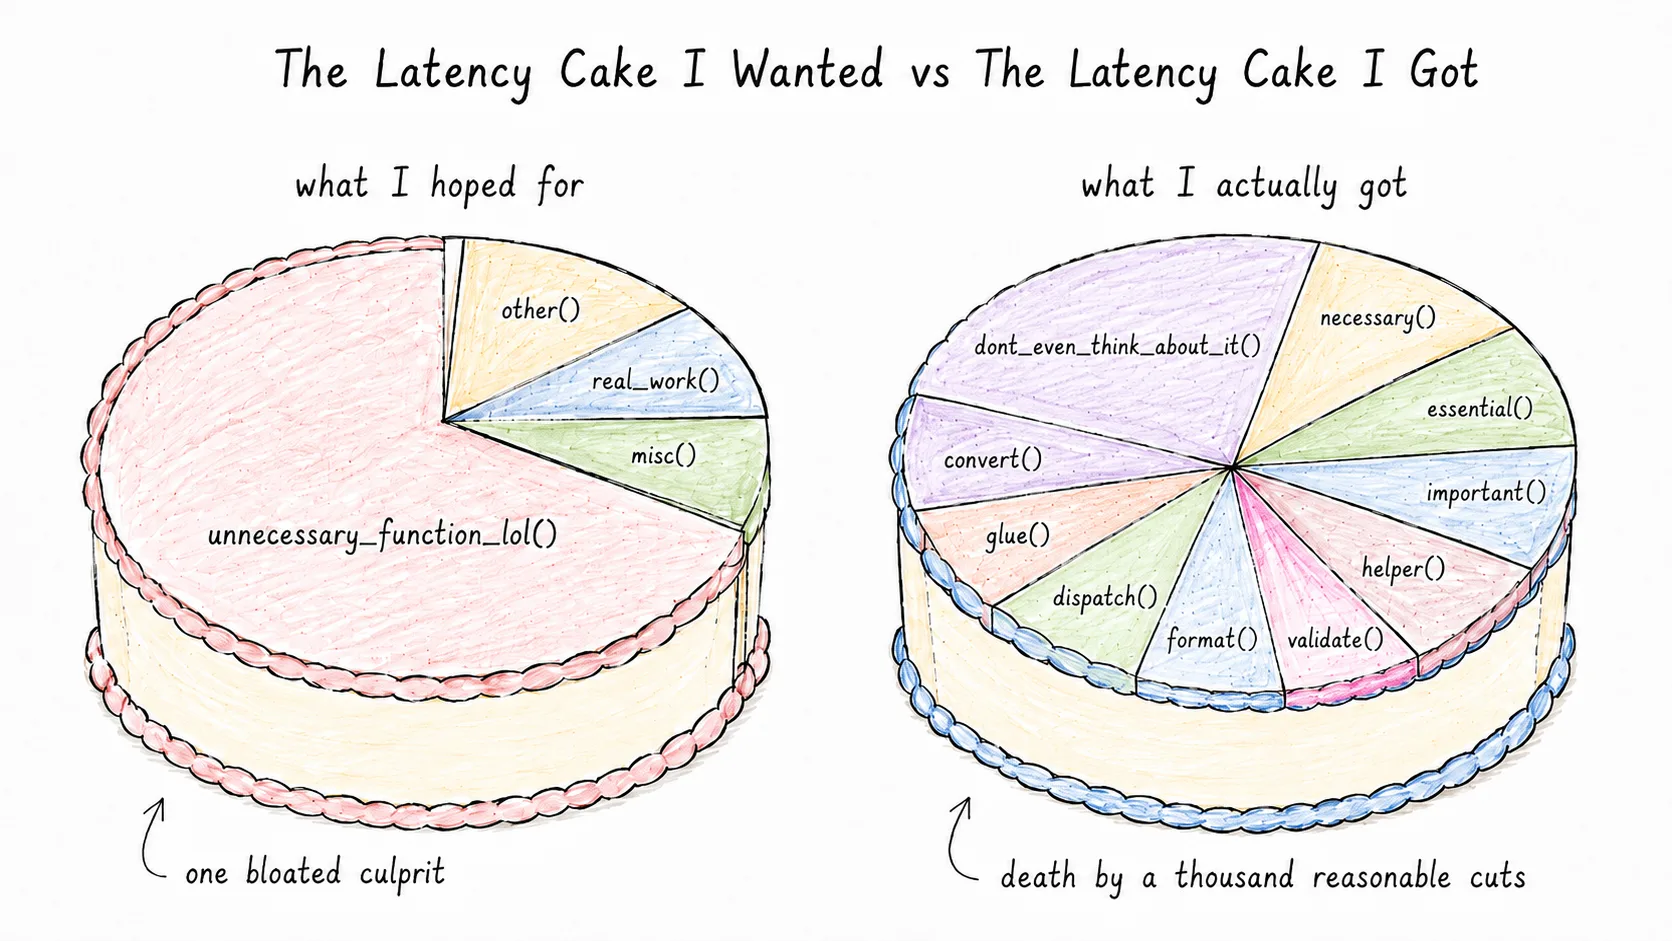
The call stack from a single request is the best summary of what is going on:
ThreadPoolExecutor worker thread
│
├─ threading._bootstrap → _bootstrap_inner → run                          [Python stdlib]
├─ concurrent.futures.thread._worker → run                                [Python stdlib]
│
├─ vllm/renderers/base.py                  _process_multimodal            ┐
├─ vllm/multimodal/processing/processor.py apply                          │
├─                                         _cached_apply_hf_processor     │  vllm
├─                                         _apply_hf_processor            │  (multimodal
├─                                         _apply_hf_processor_main       │   processor
├─                                         _apply_hf_processor_mm_only    │   framework)
├─                                         _apply_hf_processor_text_mm    │
│
├─ vllm/model_executor/models/qwen3_vl.py  _call_hf_processor             ─ vllm (Qwen3-VL adapter)
│
├─ vllm/multimodal/processing/processor.py _call_hf_processor             ┐
├─ vllm/multimodal/processing/context.py   call_hf_processor              ┘  vllm (back to base)
│
├─ transformers/models/qwen3_vl/processing_qwen3_vl.py  __call__          ─ HF (Qwen3-VL Processor)
├─ transformers/video_processing_utils.py  __call__                       ┐  HF
├─                                         preprocess                     ┘  (BaseVideoProcessor)
├─ transformers/models/qwen3_vl/video_processing_qwen3_vl.py  _preprocess ─ HF (Qwen3-VL VideoProcessor)
│
├─ transformers/image_processing_backends.py  resize                      ─ HF (TorchvisionBackend)
│
├─ torchvision/transforms/v2/functional/_geometry.py  resize              ┐  torchvision
├─                                                    resize_image        ┘
│
└─ torch/nn/functional.py                  interpolate                    ─ PyTorch
   └─ torch._C._nn._upsample_bicubic2d_aa  ← the actual math (C++)        ─ PyTorch C++
Take a breath.
Twenty-one calls deep before the actual math kernel runs, across four codebases. Together, they are why a 15-frame video takes a third of a second to prepare for the gpu.
Two types of overhead
I will spare you the full autopsy of this death by a thousand cuts. The cuts come in three categories.
-
Repeated work: Every line in the stack above is a layer boundary that repeats the same small ceremonies: validate inputs, wrap them in the next shape, dispatch, repackage on the way back. While each one is cheap in isolation, it becomes costly when twenty-one of them stack up end to end.
-
Generic traversal: This is the price of being a general-purpose tool.
vLLMand HFtransformershave to work for many model families, input shapes and configuration. So the hot path cannot assume what is coming. None of this is wrong. A general-purpose framework that serves everyone has to make those checks. Your request just happens to pay for that whole surface area, every time.
Own the hot path
The latency is a symptom of distributed custody. Four codebases each own a piece of processing, and none of them is responsible for how the whole path runs. Each piece is locally reasonable. The hot path between them has no owner.
Patching across them would mean coordinating four maintainer groups around code none of them owns end to end. Centralizing it in one place just requires writing it.
So we stopped negotiating with the existing pipeline and asked the simpler question: what is the actual work?
Starting from the math
Take one example. Decoded RGB frames for a 15-frame 480p video, going into the Qwen3-VL processor. What does the processor actually have to produce?
The work
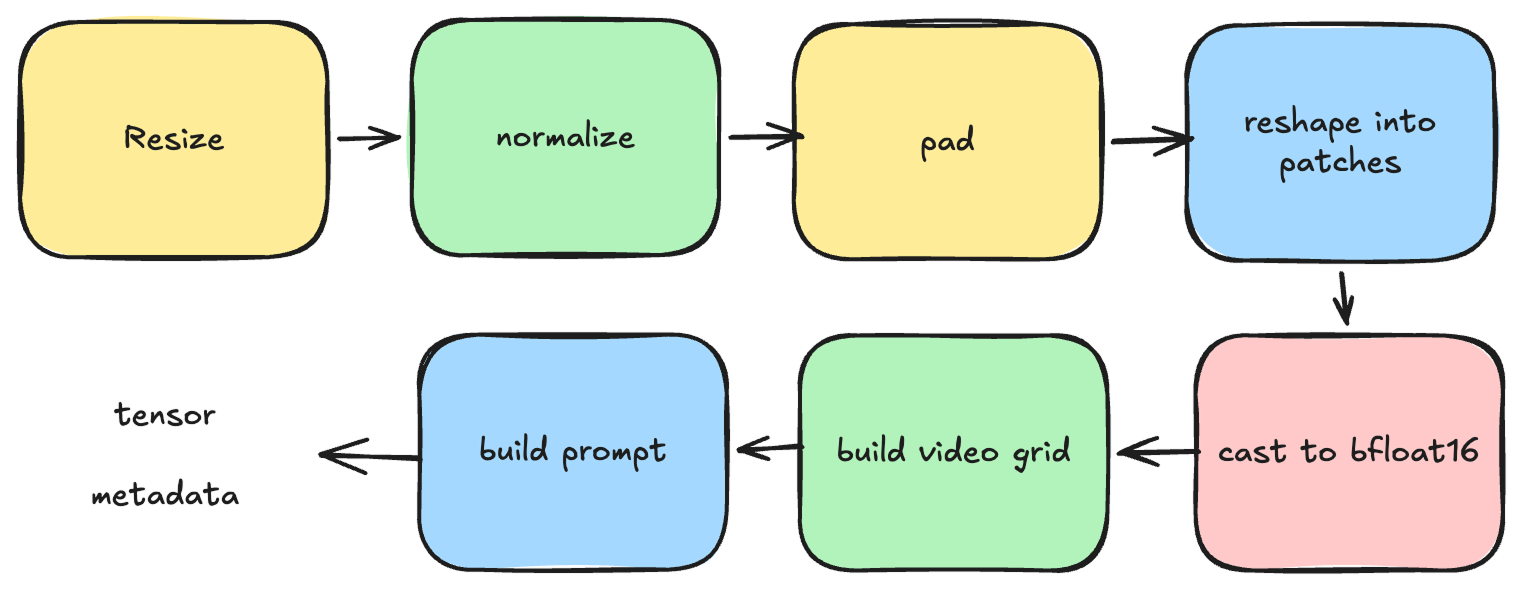
That is it. Seven steps. Most of them are one line of torch code.
The twenty-one-call stack in the previous section was wrapping these seven steps. None of those wrapping layers do work that ends up in the model's input. They validate, dispatch, repackage, traverse, group, and hand off. The math itself is small.
Re-writing the preprocessor
We wrote those seven steps in one file. No dependency on vllm's processor or HF transformers' processor stack. Just
torch and torchvision for the math.
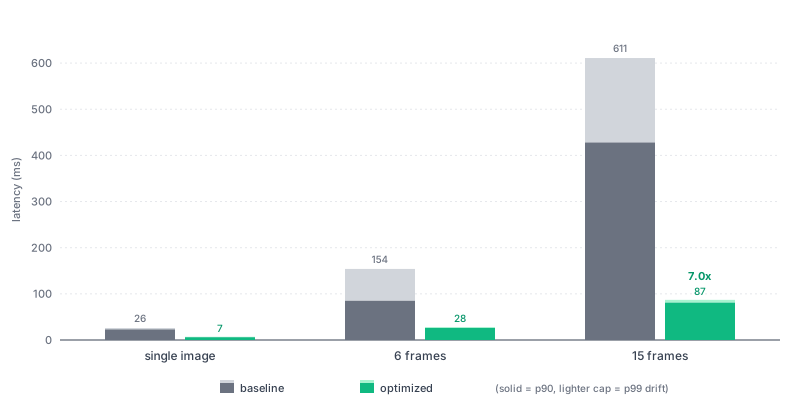
We also made further optimizations such as preallocation and loop fusion, bringing the latency down to 80ms, down from 450ms.
About 5x reduction, bit-identical.
What's more? The optimized implementation is much more stable.
What happens when you slot it into vllm
We adapted the optimized Qwen processor into vllm, wrapped it in the shape vllm's processor framework expects, and registered it as a fast path with a fallback to stock vllm on anything we have not validated:
# vllm/multimodal/processing/processor.py (overshoot fork)

def apply(self, prompt, mm_data, mm_kwargs, tok_kwargs):
    # Fast path for the model families and shapes we have validated
    if overshoot.supports(self.info, mm_kwargs):
        return overshoot.apply(
            self, prompt, mm_data, mm_kwargs, tok_kwargs,
        )

    # Everything else falls through to stock vllm
    return self._stock_apply(
        prompt, mm_data, mm_kwargs, tok_kwargs,
    )
Then we ran the same benchmark.
The latency came back at ~170 ms instead of 80ms.
Confusing: the same code we had just benchmarked at ~80 ms standalone was taking more than twice as long inside vllm, on the same hardware, with the same inputs.
The hunt
We profile the processing inside vllm and find every torch op running slower than it did standalone. Nothing about the math, the hardware, or the inputs had changed. This leaves the runtime context as the only culprit.
As it turns out, vLLM runtime restricts torch to use only one thread, instead of using all available physical cores (Torch's default behavior).
We set the environment variable OMP_NUM_THREADS=8 and the latency drops right back to ~80 ms p90.
| 15-frame, sequential | p90 |
|---|---|
| optimized core standalone | ~80 ms |
| optimized core inside vllm (default) | ~170 ms |
optimized core inside vllm (OMP_NUM_THREADS=8) | ~80 ms |
There's the one-line default we did not write, from the threading tangent. You did read it, right? Took a while to write, you wouldn't just skip it.
Provisioning threads on the optimized workload
With per-request processing down to ~80 ms and OMP_NUM_THREADS no longer silently capping torch to one thread,
choosing the right amount of preprocessing workers is just a benchmark question.
The goal: enough processor lanes to absorb bursts, few enough to leave cpu headroom for the engine and gpu worker. Benchmarking on a 16-logical-core host landed us at:
OMP_NUM_THREADS=8--renderer-num-workers=2
At those settings, we observe the following results:
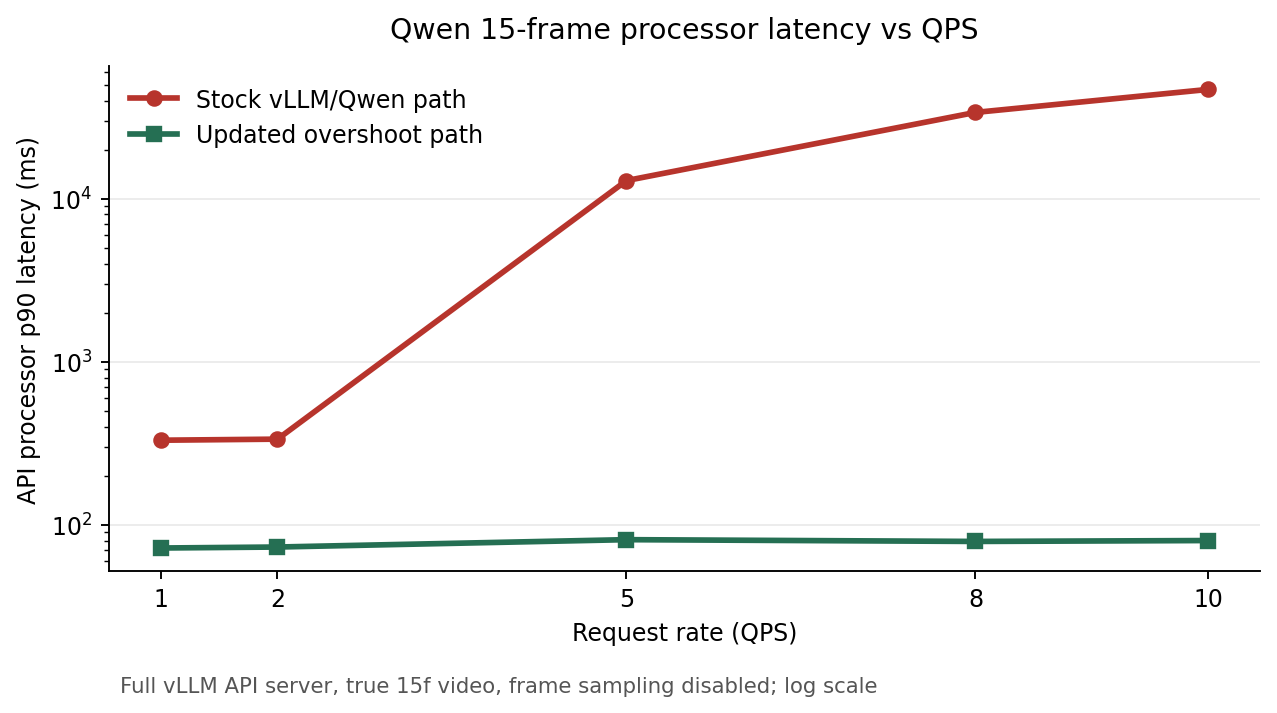
Note that the y-axis above is log-scaled.
A note on coverage
Before we wrap up, a quick note on what this fix actually covers.
Every multi-modal Qwen model released since Qwen3-VL uses this same processor: the Qwen3-VL collection, Qwen3.5, and Qwen3.6. One rewrite covers all three.
We ran the same playbook on Gemma 4 and everything ported straight over. The numbers, sequential single-request:
| input | baseline p90 | optimized p90 | speedup |
|---|---|---|---|
| single image | 20 ms | 8 ms | 2.5x |
| 6 frames | 59 ms | 15 ms | 3.9x |
| 15 frames | 114 ms | 36 ms | 3.2x |
Roughly 3x reduction across the board, Gemma's baseline was already leaner than Qwen's, and we still came out at a third of the original p90 across every bucket. The 5 QPS queue explosion that hit Qwen never showed up here since the Gemma baseline was already keeping up at that load. But we are building for realtime multimodal inference at Overshoot, and 114 ms versus 36 ms per request is worlds apart for our product even when the queue is empty.
Conclusion
Four things to take from this.
- Inference engines are not built for multi-modal latency-sensitive workloads
- Cutting through deep, layered stacks does pay off, when done carefully. Replacing a twenty-one-call path across four codebases with a small, owned core is not always the right move. When the framework cost is structural rather than local, and you have a bit-identical validation gate to keep yourself honest, it is the only move that works.
- Beware cross-cutting hidden defaults. The single most expensive bug in this story was a torch thread count being silently overridden by a runtime context vllm wraps around the processor. If we had looked at it from inside HF transformers, we would not have found it: that codebase has no idea its operations are being run on one thread. Hidden defaults that span multiple codebases only surface to whoever owns the full hot path.
- There is no magic to tail latency on gpus. Long tails in LLM serving are widely treated as a property of the workload, the model, or the gpu. Almost a law of the universe. They are not. The 11.6-second p90 we opened with came from architecture choices we could change, and there are plenty more like it waiting to be fixed.
The future of inference is faster, more stable, and ready for real time agents in the real world. If you enjoyed this blog, you will certainly enjoy working with us. Reach out to founders@overshoot.ai